This article didn't start where it ends, and for once I want to show the seams. The Italy and Spain pieces both worked the same trick: take a mediocre-looking national BEV curve, split it along a line the headline number hides (rental vs. everything else), and watch one country fall apart into two completely different markets. Naturally the next question was: where else does that trick work?
So I went through every disjoint split in the Gallery's datasets looking for a third candidate. And I found one — Denmark, where the private/corporate gap is enormous. But when I tried to write "Denmark: private buyers lead" the same way I wrote "Italy: rental drags", the story fell apart in my hands. Because two datasets to the right sat Finland, where the corporate channel leads. Same split, same years, opposite sign. One of these stories had to be fake — or both were symptoms of something else. This is the write-up of finding out what.
Denmark: a market that finished without telling anyone
First, the finding that started it. Split Danish registrations into private and corporate holders (Statistics Denmark publishes this cleanly[1]) and you get the largest gap of any split I chart: over the last twelve months, 92% of private new-car registrations in Denmark were battery-electric. The Danish private market isn't transitioning anymore; it has, for all practical purposes, arrived. The national headline of 76% is pulled down entirely by the corporate channel, which sits under 50%.
That's the mirror image of the usual European story, where company-car taxation makes fleets the spearhead. And it has a clean mechanical explanation: Denmark's registration tax (up to 150% on conventional cars) hits the private buyer with full force, while BEVs are heavily favoured. For a Danish household, a petrol car is no longer just worse, it's irrational. Fleets, which calculate in lease rates and residual values instead of sticker shock, respond more slowly.
Great story. Except.
Finland ruins the story, then becomes the story
Finland publishes the same private/corporate split, so it makes the natural control group. And in Finland the gap points the other way: the corporate channel leads. Worse — for my draft, better for the truth — it hasn't always. Finnish private buyers led until 2023 (+4.6 pp), then the sign flipped, and by 2025 corporate led by 6.6 pp.
What happened between those two dates? Finland's purchase subsidy for private BEV buyers wound down in two steps: applications closed at the end of 2022 — no funds were budgeted for 2023 — and the last subsidised cars worked through the delivery pipeline during 2023[12]. That pipeline is why the private curve kept climbing right up to its December 2023 peak before rolling over. The company-car tax advantage kept running. Within a year, the leading channel switched. Belgium, for calibration, is the extreme in the corporate direction: after its company-car tax reform, corporate registrations hit ~54% BEV against ~9% private in H1 2025[2]. EU-wide the corporate channel leads 25% to 17%[3], but T&E's country work shows that lead is carried almost entirely by Belgium, the Netherlands and Luxembourg, while corporate channels in the big four markets underperform[2].
So there is no natural leader of the transition. Households first in Denmark, fleets first in Belgium, a photo finish in Finland with the leader decided by whichever subsidy died last. Who electrifies first is not a fact about people or firms. It's a fact about tax design. Italy and Spain don't contradict this. Their corporate channels are unusually rental-heavy, and rental fleets, as both earlier articles showed, obey usage economics that no purchase incentive reaches. They're the exception that maps the rule's boundary.
But if incentives really steer this hard, that's a testable claim, and it comes with a sharp prediction: remove an incentive and the registration series must break — visibly, and timed to the policy date, not vaguely "around then". So I went looking for countries I hadn't used to form the hypothesis and checked.
Four countries cut. Four cliffs.
New Zealand ended its Clean Car Discount on 31 December 2023[4]. Monthly BEV share: 20% in December, 1% in January. Iceland ended its blanket VAT exemption the same week[5]: 86% in December, 37% in January, 13% by April. Germany's Umweltbonus died in two steps. Corporate buyers lost it on 1 September 2023, everyone else in a chaotic overnight stop that December[6]. And the German series breaks twice, once at each date: August 32%, September 14%; then 2024 lands at 13.5% after 2023's 18.4%. Sweden abolished its Klimatbonus in November 2022[7]: December spiked to 51% on pull-forward orders, January fell back to 28%.
Every single case shows the same signature — a spike in the last eligible month, a crater in the first ineligible one. And the counterfactual behaves too: the UK (mandate, no subsidy cut), France, Portugal, Norway and Belgium show no such dent at all. I don't get to run controlled experiments on car markets, but this is about as close as observational data comes.
The gut-feeling hypothesis
At this point I had a suspicion that I want to state plainly before showing the test, because stating your hypothesis before looking is the whole game: (a) incentives only accelerate the transition — take them away and it still happens, just later; and (b) how much damage a cut does depends on how far the transition has already come. Cut early and you knock the market out for years. Cut late — somewhere past 70, 80, 90 percent — and nothing much should happen at all.
The removal cases above happened at very different points of the S-curve, which is exactly what's needed to test that. And once I started collecting cut events systematically, the sample grew well past the original four: Denmark's 2016 registration-tax phase-in (BEVs at 2% of the market — it killed 85% of them), the UK's quiet Plug-in Car Grant burial in June 2022[11], France's step-wise bonus reductions, the US federal credit ending September 2025, the Netherlands' 2016 company-car tax change that erased 94% of its PHEV market, Norway's gradual late trimming at 78%. Every point is one cut:
| Country | Cut | Share at cut | Dose* | Relative drop | Back to peak after |
|---|---|---|---|---|---|
| Netherlands (PHEV) | 2016–17, company-car tax | 9% (PHEV) | very high | −94% | 70 months |
| Denmark | 2016, tax phase-in | 2% | ~7–9%, rising | −85% | 45 months |
| New Zealand | Jan 2024, + road charges | 10% | ~15–19% | −66% | not yet (30+ months) |
| USA | Oct 2025 | 8% | ~16% | −17% so far | ongoing, still falling |
| Germany | Sep + Dec 2023 | 20% | ~11% | −34% | 27 months |
| France | 2024–25, in steps | 18% | ~2% per step | −5% | 9 months |
| UK | Jun 2022 | 15% | ~2–5% | −1% (none) | immediately |
| Sweden† | Nov 2022 | 30% | ~10–14% | −14% | never below pre-cut level |
| Iceland | Jan 2024, + km charge | 50% | ~20%+ | −41% | not yet, rising |
| Norway | 2023, partial & gradual | 78% | small per step | ~0% | immediately |
*Dose = the price shock as a share of a typical BEV's purchase price in that market: purchase incentives, VAT and registration taxes, plus new recurring charges roughly as a four-year cost. Values marked ~ are estimated from the policy parameters (grant amounts, tax rates), not from computed transaction prices — treat them as order-of-magnitude. Market response columns are computed from the Gallery's registration data (trailing-twelve-month share, peak to post-cut trough). "Share at cut" is the TTM share at the cut date; Germany uses the September corporate step, where its series peaked.
†Sweden's Klimatbonus applied to cars ordered by 8 November 2022, so deliveries kept the TTM series rising for almost a year after the cut. Its −14% is measured from that delivery-inflated peak (Oct 2023) to the trough (Nov 2024); the series never dropped below its level at the cut date itself.
Read the drop column against the share column and the pattern is almost embarrassingly clean: 2% → −85%, 10% → −66%, 20% → −34%, 30% → −14%, 78% → 0. The later you cut, the less it costs, monotonically (except Iceland, sitting at 50% with a drop that "should" be Sweden-sized and isn't, and the UK, which cut at 15% — right between New Zealand's disaster and Germany's crater — and felt nothing).
I like these outliers, because they forced a refinement instead of a retreat, and the refinement is in the dose column. The UK's final Plug-in Car Grant was £1,500, restricted to cars under £32,000[11] — a token, maybe 2–5% of a typical BEV's price, and the market shrugged. Iceland didn't remove a subsidy: it removed the entire VAT exemption and introduced a per-kilometre road charge in the same month[5] — the largest single repricing shock in this sample, and it bought Iceland three times the damage Sweden took from a moderate cut twenty points earlier in the transition. New Zealand, the other over-performer on the damage scale, also stacked new road-user charges on top of its subsidy cut. And the Netherlands' company-car tax change — which roughly tripled the annual tax cost of a PHEV, the biggest effective dose here — produced the deepest, longest crater of all. So the working model gets two dials instead of one: the size of the crater is set by the dose; how long the crater lasts is set by the stage.
And the second half of the hypothesis — that the transition resumes regardless? It holds everywhere. Germany regained its pre-cut peak after 27 months without the purchase subsidy coming back, and now sits above it. Even Denmark's near-dead 2017 market stands at 76% today (with the honest caveat that Denmark also softened the tax phase-in along the way — Germany is the clean case). Iceland is back to 45% and climbing. Nobody stays down. The destination appears to be fixed; incentives negotiate only the arrival time.
Hong Kong: the same experiment, run three times
One cell of the matrix stayed empty, and it happens to be the one my whole late-stage claim rests on: an abrupt, complete removal at very high BEV share. Norway trimmed gradually. Denmark's big test is still years out. No country in the Gallery's datasets has ever done it.
One city has. Hong Kong. It's not in my datasets, but tracked monthly by Roland Pircher, whose Hong Kong series I've followed long enough to trust on a market I was deliberately testing blind[8]. The city ended all first-registration-tax (FRT) concessions for electric private cars on 31 March 2026, with BEV penetration around ninety percent[9]. That's the experiment the sample lacked. But when I looked at the past, it turned out Hong Kong hadn't run the experiment once, but three times, at three different points of the curve, and the earlier two tell you how to read the third.
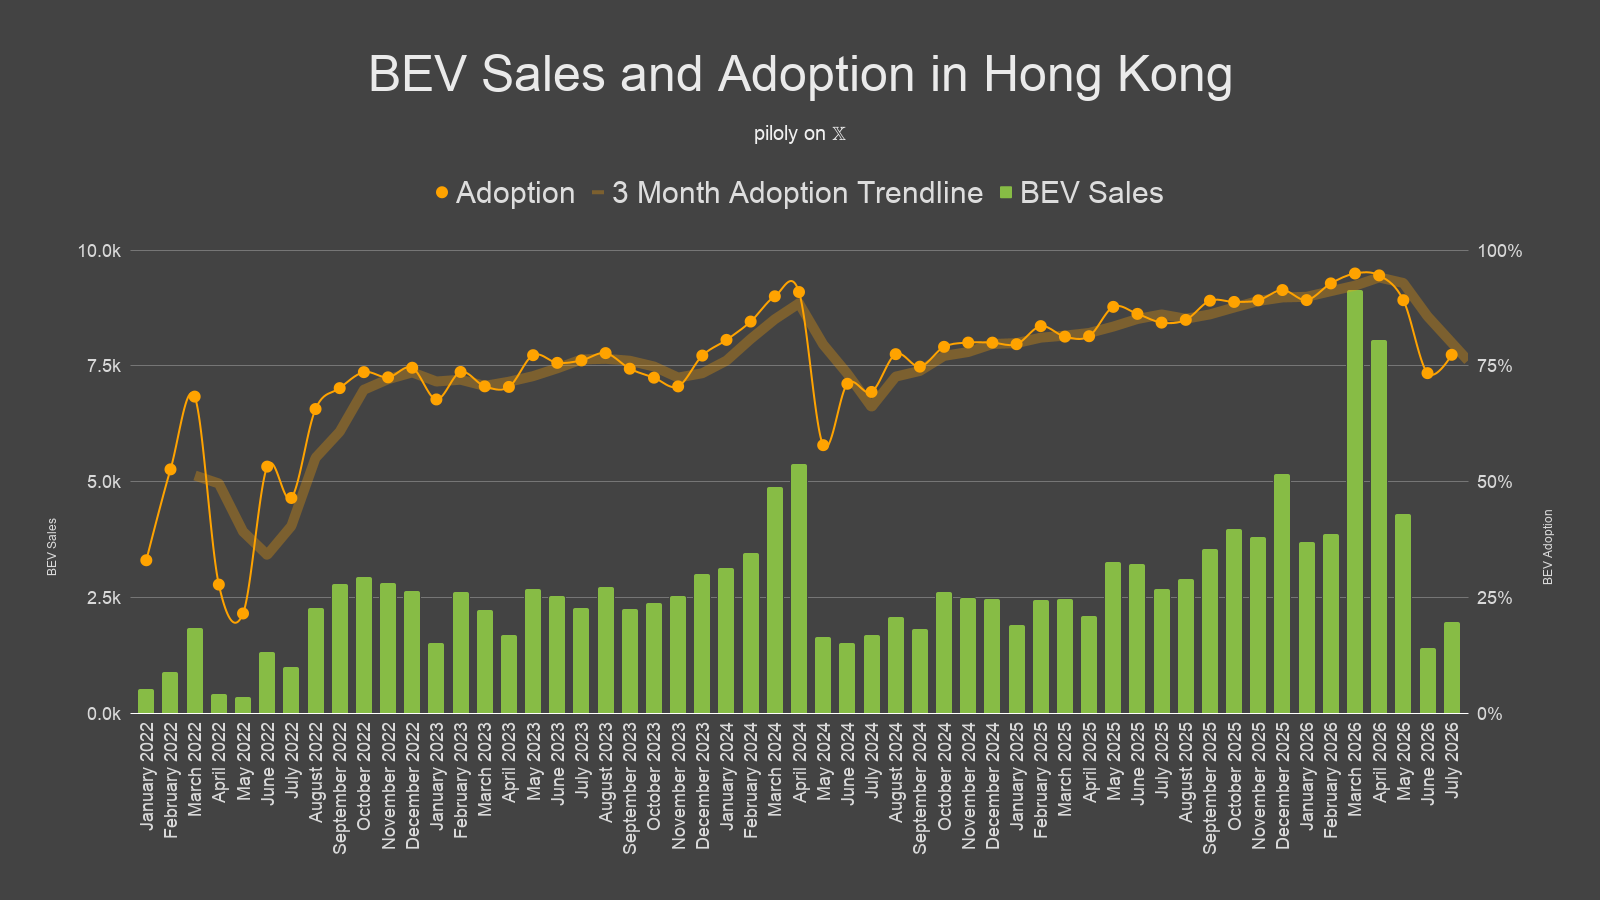
Look at the two cliffs in that chart, and then at what doesn't happen in between. The spring of 2024 drops from 91.0% in April to 57.9% in May — a 33-point fall in one month. The spring of 2026 slides from 94.6% in April to 89.2% in May to 73.4% in June. But the springs of 2023 and 2025? They rise: April→May of +6.8 and +6.4 points. Same calendar slot, opposite direction. The driver isn't the season.
It's the budget. Hong Kong's fiscal year ends 31 March, the budget lands in late February, and the FRT concessions always expired on 31 March / 1 April. In 2023 and 2025 the concession was simply running — no change, and the share drifted up as it had all along. In 2024 the February budget cut the FRT waiver by 40% (from HK$287,500 to HK$172,500) effective 1 April[9]; buyers pulled forward into March, and May fell off a cliff. In 2026 the budget ended the concession entirely on 31 March. Two policy changes, two dips, each timed to the exact month the price of an EV jumped. The one spring that looks like an exception — 2022, which also dipped — is the Omicron wave, when Hong Kong's whole car market briefly collapsed to a few hundred cars a month and the percentage is just noise.
So the "seasonal fade" I'd have to worry about turns out to be a policy fingerprint — and that hands us a second clean experiment for free. The 2024 cut is a smaller-dose rehearsal of 2026: a partial removal (−40% of the waiver) at ~91% share. Its immediate hit was actually sharper than 2026's so far (−33 points month-on-month vs. −22 from the spike), and then — this is the part that matters — it recovered without the waiver coming back. The waiver stayed cut. Yet share climbed off the 57.9% floor through the summer (71%, 69%, 78%…), was back to 80% by year-end, and above 90% through 2025. That's H4 playing out inside a single city: the incentive bought timing, not the destination. And it sharpens the stage rule too — the bigger dose in 2026 (full removal) landed a smaller blow than the partial 2024 cut, because 2026 caught the market four points higher up the curve and that much closer to price parity.
Which reframes the 2026 dip. Yes, June's 73.4% is a real drop — down from ~90%, and year-on-year from 86.3% in June 2025, so it survives any seasonal adjustment. But we've now watched Hong Kong take a comparable hit in 2024 and shrug it off entirely. The honest read on the live experiment is: exactly the shallow, recoverable bite the stage rule predicts at ninety percent — not the "nothing happened" the pre-deadline months teased, and not a cliff either. On the 2024 template, June's 73% should be a way-station, not a floor — and July, which landed as I was finishing this, came in at 77.4%, up four points, recovery starting exactly one month after the trough just as it did in 2024. The way-station call was right.
And Hong Kong brings its own early-stage control, to complete the curve: in April 2017 the same city capped what was then a full tax waiver — when BEVs were a sliver of the market — and Tesla went from 2,939 registrations in March to 32 in the remaining nine months of the year[10]. One city, three cuts — 2017 near zero, 2024 and 2026 near the top — and the damage shrinks every time the transition is further along. The whole thesis of this article, inside a single set of number plates.
What I actually learned
- There is no natural first-mover. Private households lead where taxes punish private ICE purchases (Denmark), fleets lead where company-car taxation does the pushing (Belgium), and the leader flips when one incentive outlives the other (Finland, 2024). Any story that explains the gap with national character is fake until it has checked the tax code.
- Incentive removal is instant and proportional to the dose. Spike, cliff, crater — visible within one month, in every case, and deepest where subsidies were cut and new charges added simultaneously (Iceland, New Zealand).
- The damage is temporary, and both its depth and duration shrink as the transition matures. −85% at a 2% market. −34% at 20%. A shallow ~20% dip even at 90% under a full, abrupt cut (Hong Kong 2026) — and Hong Kong's own 2024 partial cut proves the recovery: it fell to 57.9% and climbed back above 90% with the waiver still cut. Every market, without exception, resumes course.
- Rental fleets and the used market remain the exception — the channels where usage economics outweigh any incentive. That's the deeper reason the Italy and Spain curves look the way they do, and why the Netherlands' used-BEV share fell from 2022 through 2025 — with only a first tentative uptick in 2026 — while its new-BEV share soared: the domestic used market isn't absorbing the lease returns. That one deserves its own article.
The field guide: what to expect, in numbers
All of which condenses into something I didn't expect to be able to write when this started: a rough planning table for subsidy decisions. Every number below is bracketed by the historical cases above — nothing is modelled, everything can be checked against the table by hand.
- How hard is the crash? Cut early (under ~10% share) with a big abrupt dose and you lose two-thirds to nearly all of the market (NZ −66%, DK −85%, NL-PHEV −94%). Cut mid-transition (15–30%) with a moderate dose (~10–15% of car price) and you lose 5–35% (SE, FR, DE). Cut late (past ~70%) and even a full, abrupt dose only shaves off ~20% (Hong Kong) — or nothing, if it's gradual (Norway).
- How much time is lost? Early cuts: four to six years (DK 45 months, NL-PHEV 70, NZ still down after 30). Mid-stage: zero to ~27 months (SE ~0, FR 9, DE 27). Late: none. Each stage of maturity buys back roughly an order of magnitude of recovery time.
- When is removal safe? "Safe" is really "cheap enough". A single moderate incentive removed at ~30% share never drives the market below its level at the cut date. It only shaves ~14% off the delivery-inflated peak (Sweden), i.e. it slows the climb without losing ground. Removing everything abruptly still costs a ~20% dip even at 90% (Hong Kong). That's cheap relative to the level, but not free; do it gradually and it's free (Norway). 50% is demonstrably not enough to absorb a full-dose double shock (Iceland). The lesson isn't a single safe threshold. It's that price matters less and less the higher you are.
- Which incentives can go first? Grants whose dose has shrunk below ~5% of the car's price can go. They've stopped being load-bearing (UK). Also essentially anything, if removed as a pre-announced staircase of small steps: France's step-wise bonus cuts cost 5% and nine months; Israel has been raising its EV purchase tax in annual steps from 10% toward 48% through the middle of its transition without a visible crater just because of that; Norway trimmed gradually at the top. No staircase in the sample produced a cliff.
- What never to do: stack a subsidy removal with a new recurring charge in the same month mid-transition — that's the Iceland/New Zealand signature, and it roughly doubles the damage you'd expect from the subsidy cut alone. And remember the German lesson: a cut that targets one channel craters that channel on its own schedule — the corporate-only September cut broke the national series months before the general one did.
For policymakers the translation is short: early in the transition, incentives are load-bearing — remove them abruptly and you lose years. Late in the transition they're scaffolding on a mostly finished building. Pull it and you get a wobble, but not a collapse. The interesting question was never whether to remove them, but when and how: past 30%, moderate single cuts are survivable; staircases are survivable almost everywhere; and if you must cut mid-transition, cut one thing at a time.
And the test is now live rather than scheduled. When I first drafted this, Hong Kong's post-deadline months hadn't landed and April/May still looked suspicious. June landed while I was writing: a real dent, 73.4%, exactly the kind of shallow bite the stage rule predicts at ninety percent — but a dent, not the non-event the pre-deadline months implied. Then July landed before I could publish: 77.4%, already climbing back, right on the 2024 template. It's a good reminder of what this whole exercise is: not a finished law of subsidies, but a set of rules-of-thumb that each new month gets to confirm or embarrass — and this month, confirm. The Gallery will be watching.